
NYSE · Metallurgical coal
Alpha Metallurgical Resources: one peak year, divided by a third fewer shares
A metallurgical coal producer near the cycle trough: liquidity, costs and buybacks frame the case for a potential recovery.
Share price
Since purchase
Price in local currency, excluding dividends. Latest available quote; may be delayed.
The thesis in three points
- Opportunity
- Exposure to a metallurgical coal recovery with a share count reduced by buybacks.
- Key assumption
- Liquidity can bridge the downturn without dilution; 2022 earnings are not a normal year.
- What to monitor
- Available cash, cost per ton, maintenance capex and realised prices relative to break-even.
Valuation and prices refer to the original analysis date. Subsequent updates are identified separately.
In this analysis
Published July 2026. Share price ~$144; 12,752,824 shares outstanding (31-Mar-2026) for a market cap of ~$1.83bn. The stock is ~43% below its 52-week high of $253.82. Reasoning in owner’s earnings, free cash flow and through-the-cycle amplitude — no EBITDA.
The one-paragraph version
Alpha is the largest pure-play metallurgical coal producer in the United States. It sells the coking coal that becomes the coke that reduces iron ore inside a blast furnace — the route that still makes roughly 70% of the world’s steel and for which there is no scaled substitute. The commodity is violently cyclical and AMR has heavy operating leverage to it: at the 2022 peak it earned ~$1.45bn of net income and ~$1.3bn of free cash flow in a single year, against a market capitalisation of ~$1.83bn today. It carries $12.2m of total debt against $367m of cash and short-term investments, and it has spent the downturn retiring ~32% of its own shares. That combination produces the number this thesis is built on: 2022’s net income, divided by today’s share count, is ~$114 per share — against a share price of ~$144. You are paying roughly 1.3x the earnings of the last peak, without assuming the next one is better. The rest of the work is establishing that the company survives the trough long enough to reach it, and that the supply side stays broken.
Why metallurgical coal is not “just coal”

The distinction the market blurs: metallurgical (coking) coal and thermal coal are different products with different destinies. Thermal coal is burned for electricity and is in structural decline as renewables displace it. Metallurgical coal is a chemical reactant in steelmaking, and its demand is coupled to steel, not to power.
The chemistry is the moat. Iron exists in the crust only as iron oxide, which must be chemically reduced to metallic iron. In the blast-furnace / basic-oxygen route — roughly 70% of world steel — that reduction is done by coke, which is near-pure carbon made by baking metallurgical coal at ~1,000-1,100°C in an oxygen-free oven. Inside the furnace the coke does three jobs at once: fuel, chemical reducing agent, and the permeable structure that holds up the ore burden while gas and molten metal pass through it. Nothing else does all three at industrial scale. Scrap-fed electric arc furnaces are growing and matter at the margin, but you cannot build the world’s incremental steel out of recycled steel alone. Global coking coal demand runs at roughly 1,114 Mt a year, and steelmaking is where essentially all of it goes.
The bear case deserves stating plainly: the IEA projects that demand declining gradually this decade, from ~1,114 Mt toward ~1,061 Mt by 2030, as EAF share rises and Chinese steel plateaus. That is real. But a 5% demand glide-path over a decade matters far less than what happens to supply over the same period — and the IEA itself flags India as the offsetting force.
India, with numbers
“India rising” is the weakest kind of argument without figures, so here they are. India imported 83.1 Mt of coking coal in 2025, up 9.4% year on year, and S&P Global projects that reaching ~94 Mt in 2026 and ~149 Mt by 2035. A separate EY-Parthenon/Indian Steel Association study puts import demand up 42% to ~115 Mt by 2030. The driver is policy: installed steel capacity of ~200 Mt is targeted to reach 300 Mt by 2030-31 — reaffirmed in February 2026 — and ~400 Mt by 2035-36, with roughly 64-65% of the capacity under development on the blast-furnace route at ~770 kg of met coal per tonne of steel.
The structural part is that India cannot supply itself: domestic coking coal is high-ash, high-sulphur and washes poorly, leaving the country dependent on imports for around 90% of its needs. The government’s Mission Coking Coal targets 140 Mt of raw domestic production by 2030, but the low washed yield is precisely why three independent forecasters still project imports rising. Meanwhile the US share of Indian imports has gone from 8% (2021) to 15% (2025), and US met exports are projected to fall toward 38 Mt by 2035 against Indian import demand of ~149 Mt.
These are third-party projections spanning a decade and should be treated as direction, not precision.
The structural squeeze: essential product, capital-starved supply
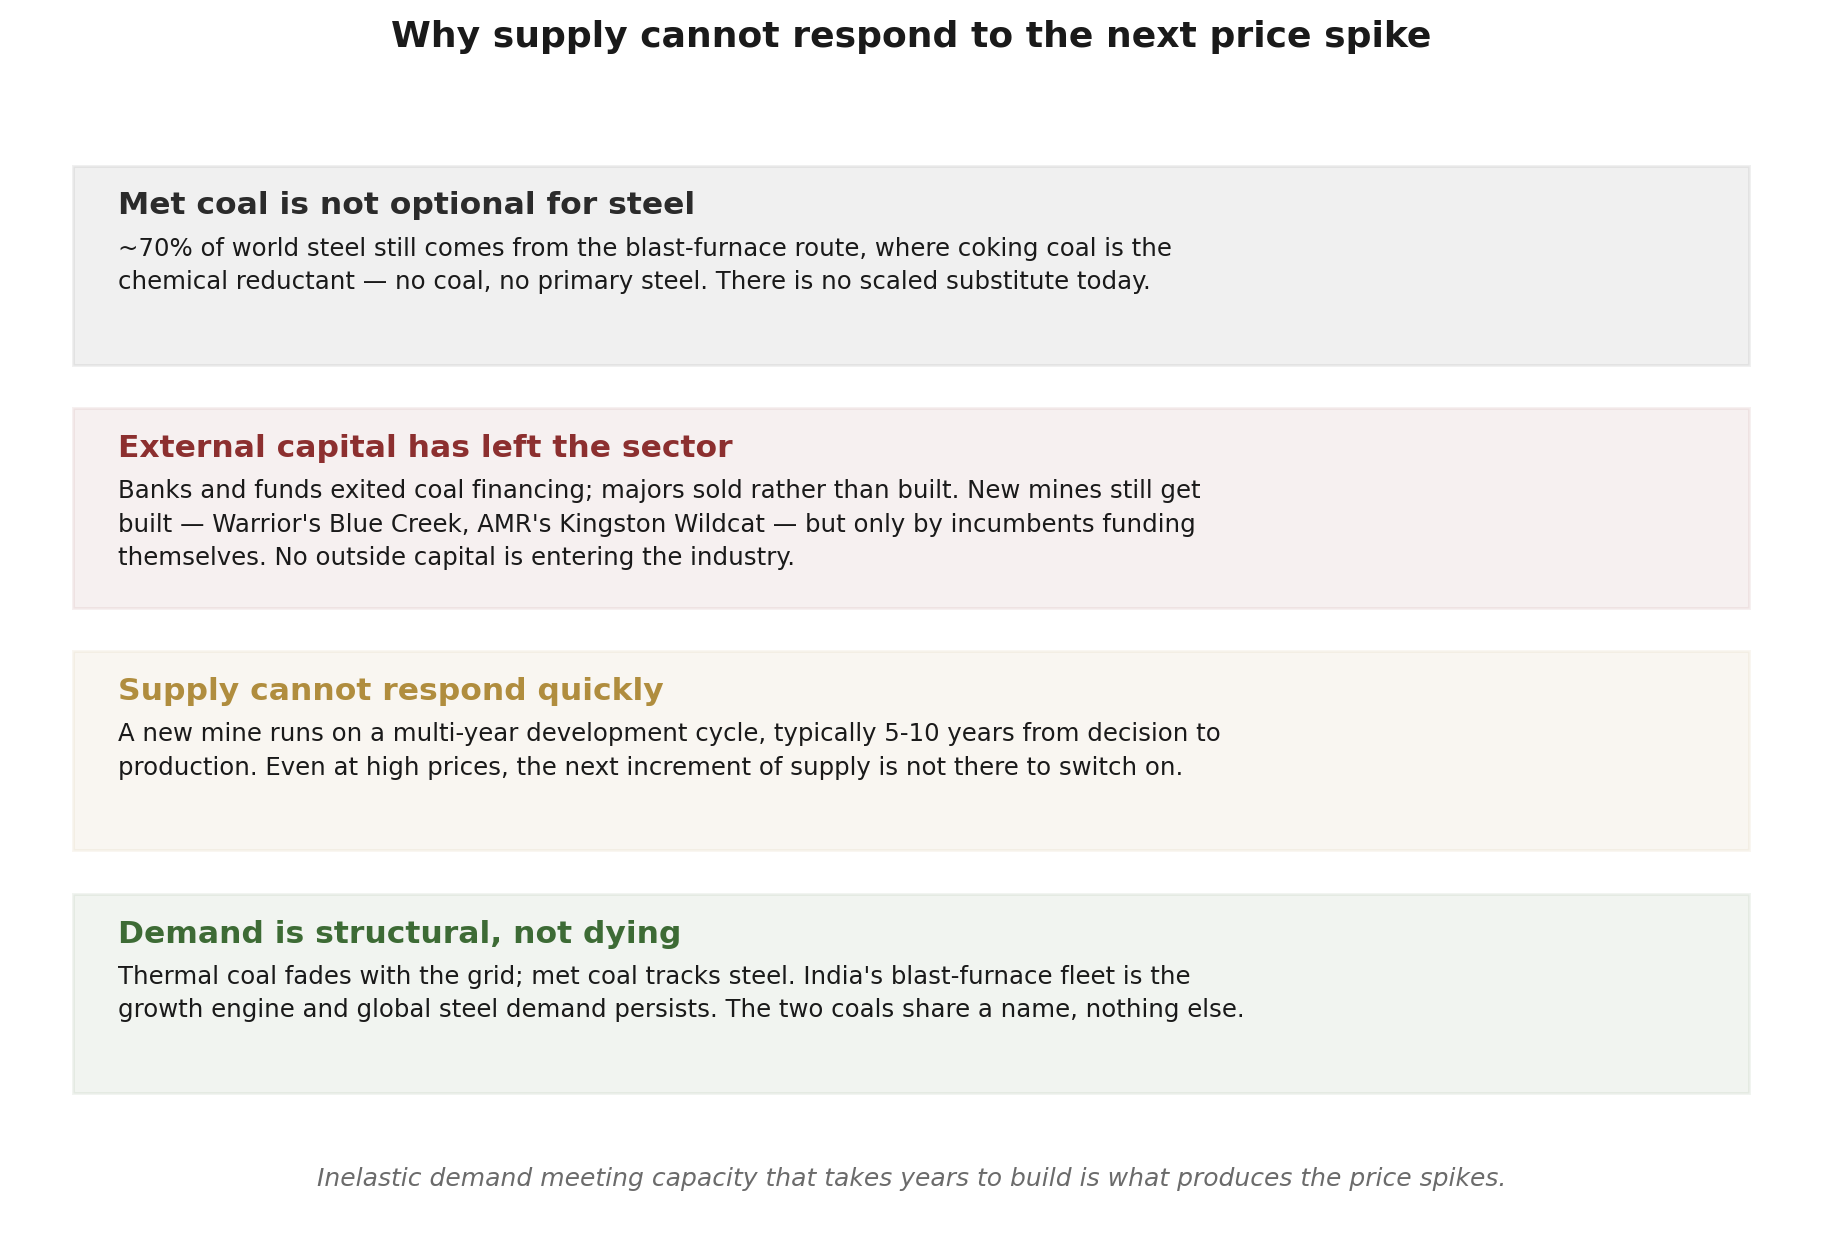
External capital has left the sector. For most of the last decade, financing for metallurgical coal has been withdrawn on ESG grounds — banks won’t lend, funds won’t hold, insurers won’t cover. Core Natural Resources’ CEO described met-coal output as “constrained by years of underinvestment, ongoing degradation and depletion of the global reserve base, as well as continuing regulatory pressure.”
The honest qualification, because a reader who follows the sector will supply it otherwise: new mines are still being built. Warrior Met’s Blue Creek completed construction in Q1 2026 at a cost of over $1.0bn and lifts its nameplate capacity by 88%; AMR has its own Kingston Wildcat ramp. The accurate statement is not “no new supply” but that greenfield capital now exists only inside self-funding incumbents. No outside capital is entering the industry. That does not weaken the thesis — it concentrates the benefit in the handful of producers strong enough to fund themselves, which is the group AMR belongs to.
A new mine takes the better part of a decade. Permitting, developing and ramping a greenfield mine runs roughly 5-10 years. By the time high prices would justify new capacity, the cycle has often turned again. That lag is why met-coal prices move so violently: small shifts in supply or demand have nowhere to go but price.
Depletion is silent and relentless. Existing mines deplete, reserves degrade, the best seams get mined first. Without sustained reinvestment the aggregate supply base ratchets down before any demand shock.
The cycle has a base rate
“Wait for the cycle” is only useful if the cycle has a track record. Met coal has spiked roughly every four to six years, and the spikes share an origin: they come from the supply side, not from a demand boom. The 2008 contract benchmark near $300/t; the 2011 spot move above $330/t on the Queensland floods; the 2016 run toward $300/t on China’s 276-day production policy; and the 2021-22 record, with premium Australian coking coal reaching roughly $600-670/t in March 2022. Four spikes in about fifteen years, each triggered by supply disruption in a market that cannot add supply quickly.
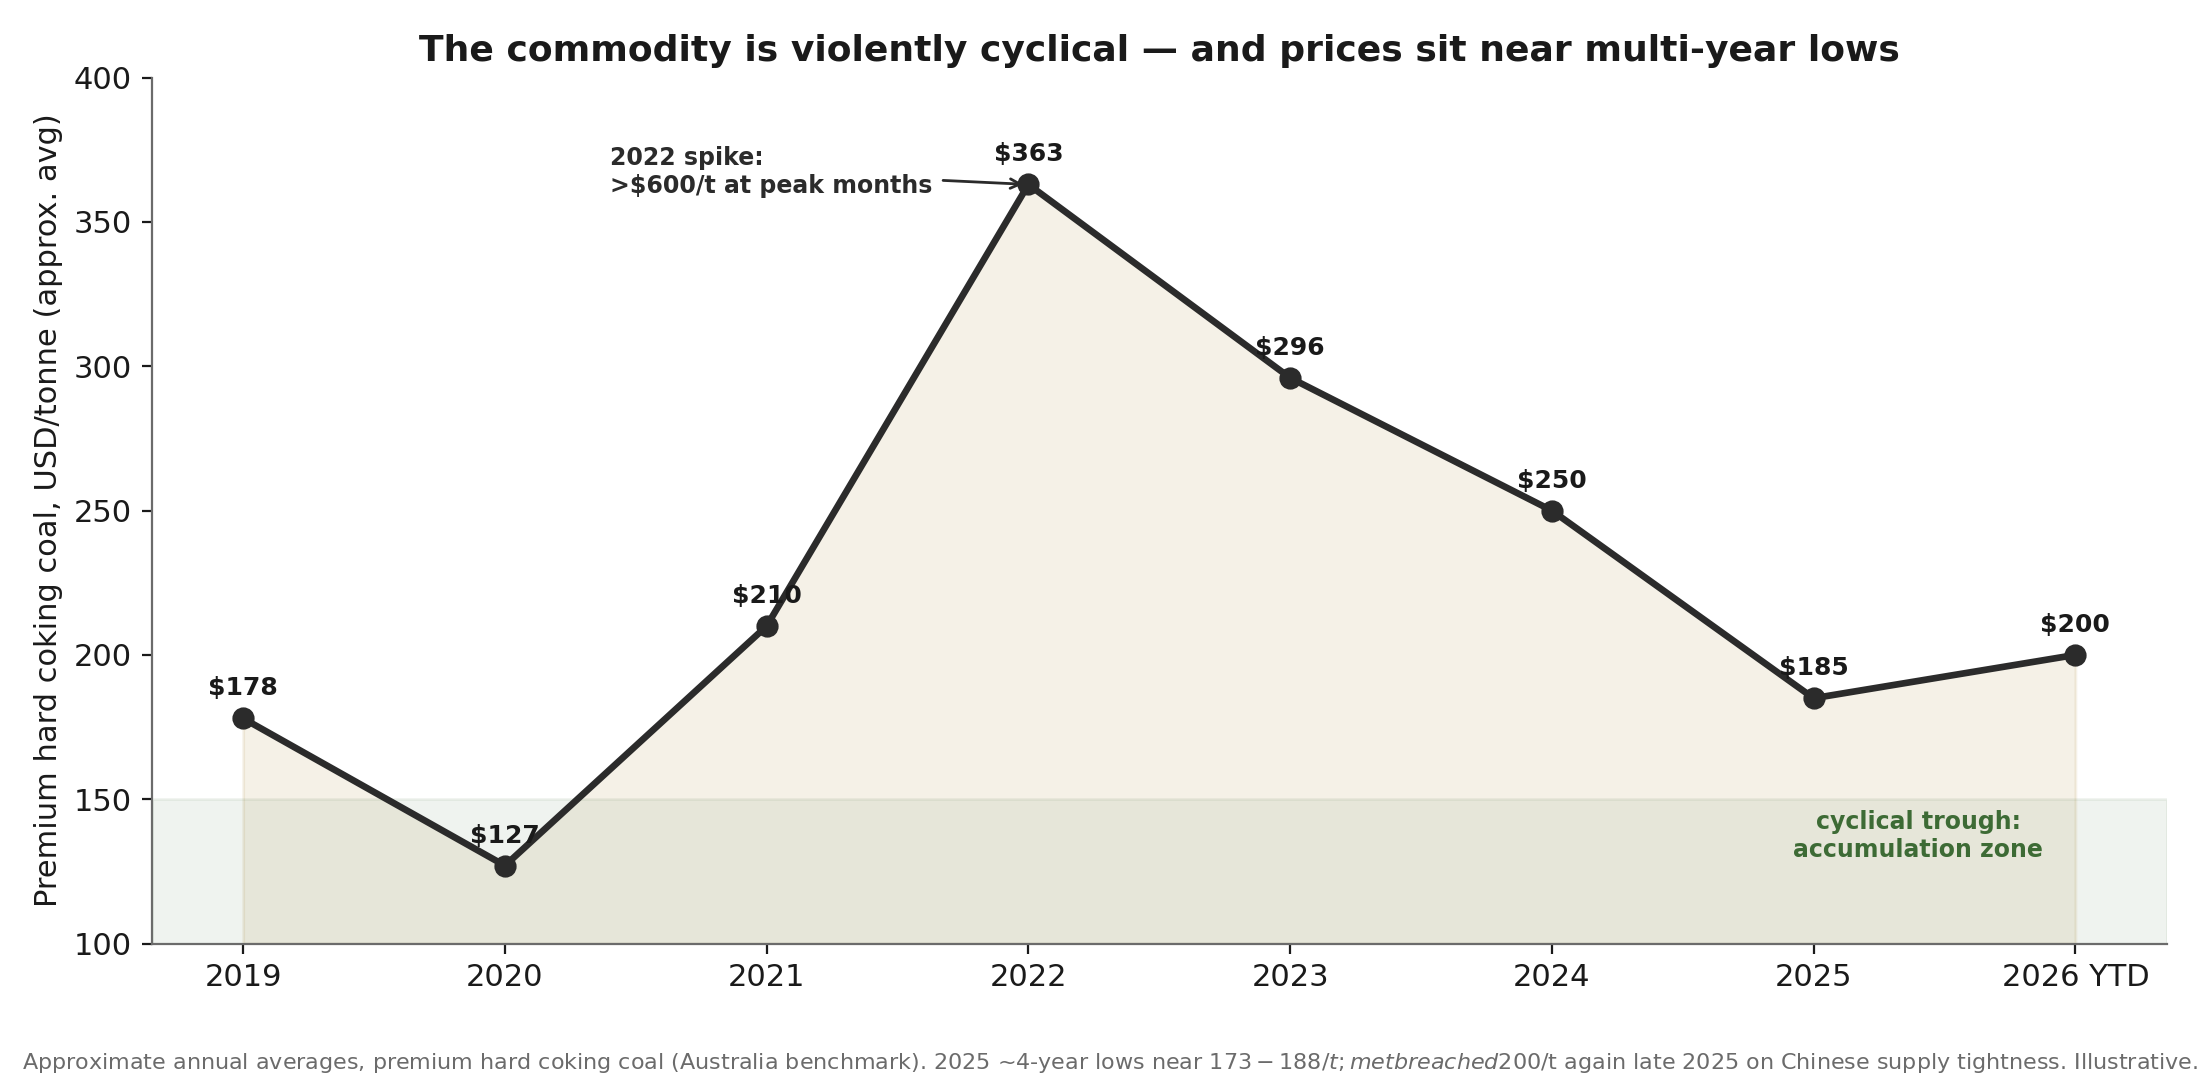
The Platts High Vol A US East Coast benchmark hit roughly $300/t at its October 2023 high and fell to about $172/t by May 2025 — a 43% drop in eighteen months, which is a normal amplitude here rather than an outlier. La Niña and the Queensland flood season remain a recurring shock generator that requires demand to do nothing at all.
The four historical price points above are approximate and should be checked against Platts or Argus before being relied on.
The peak-year economics, per share
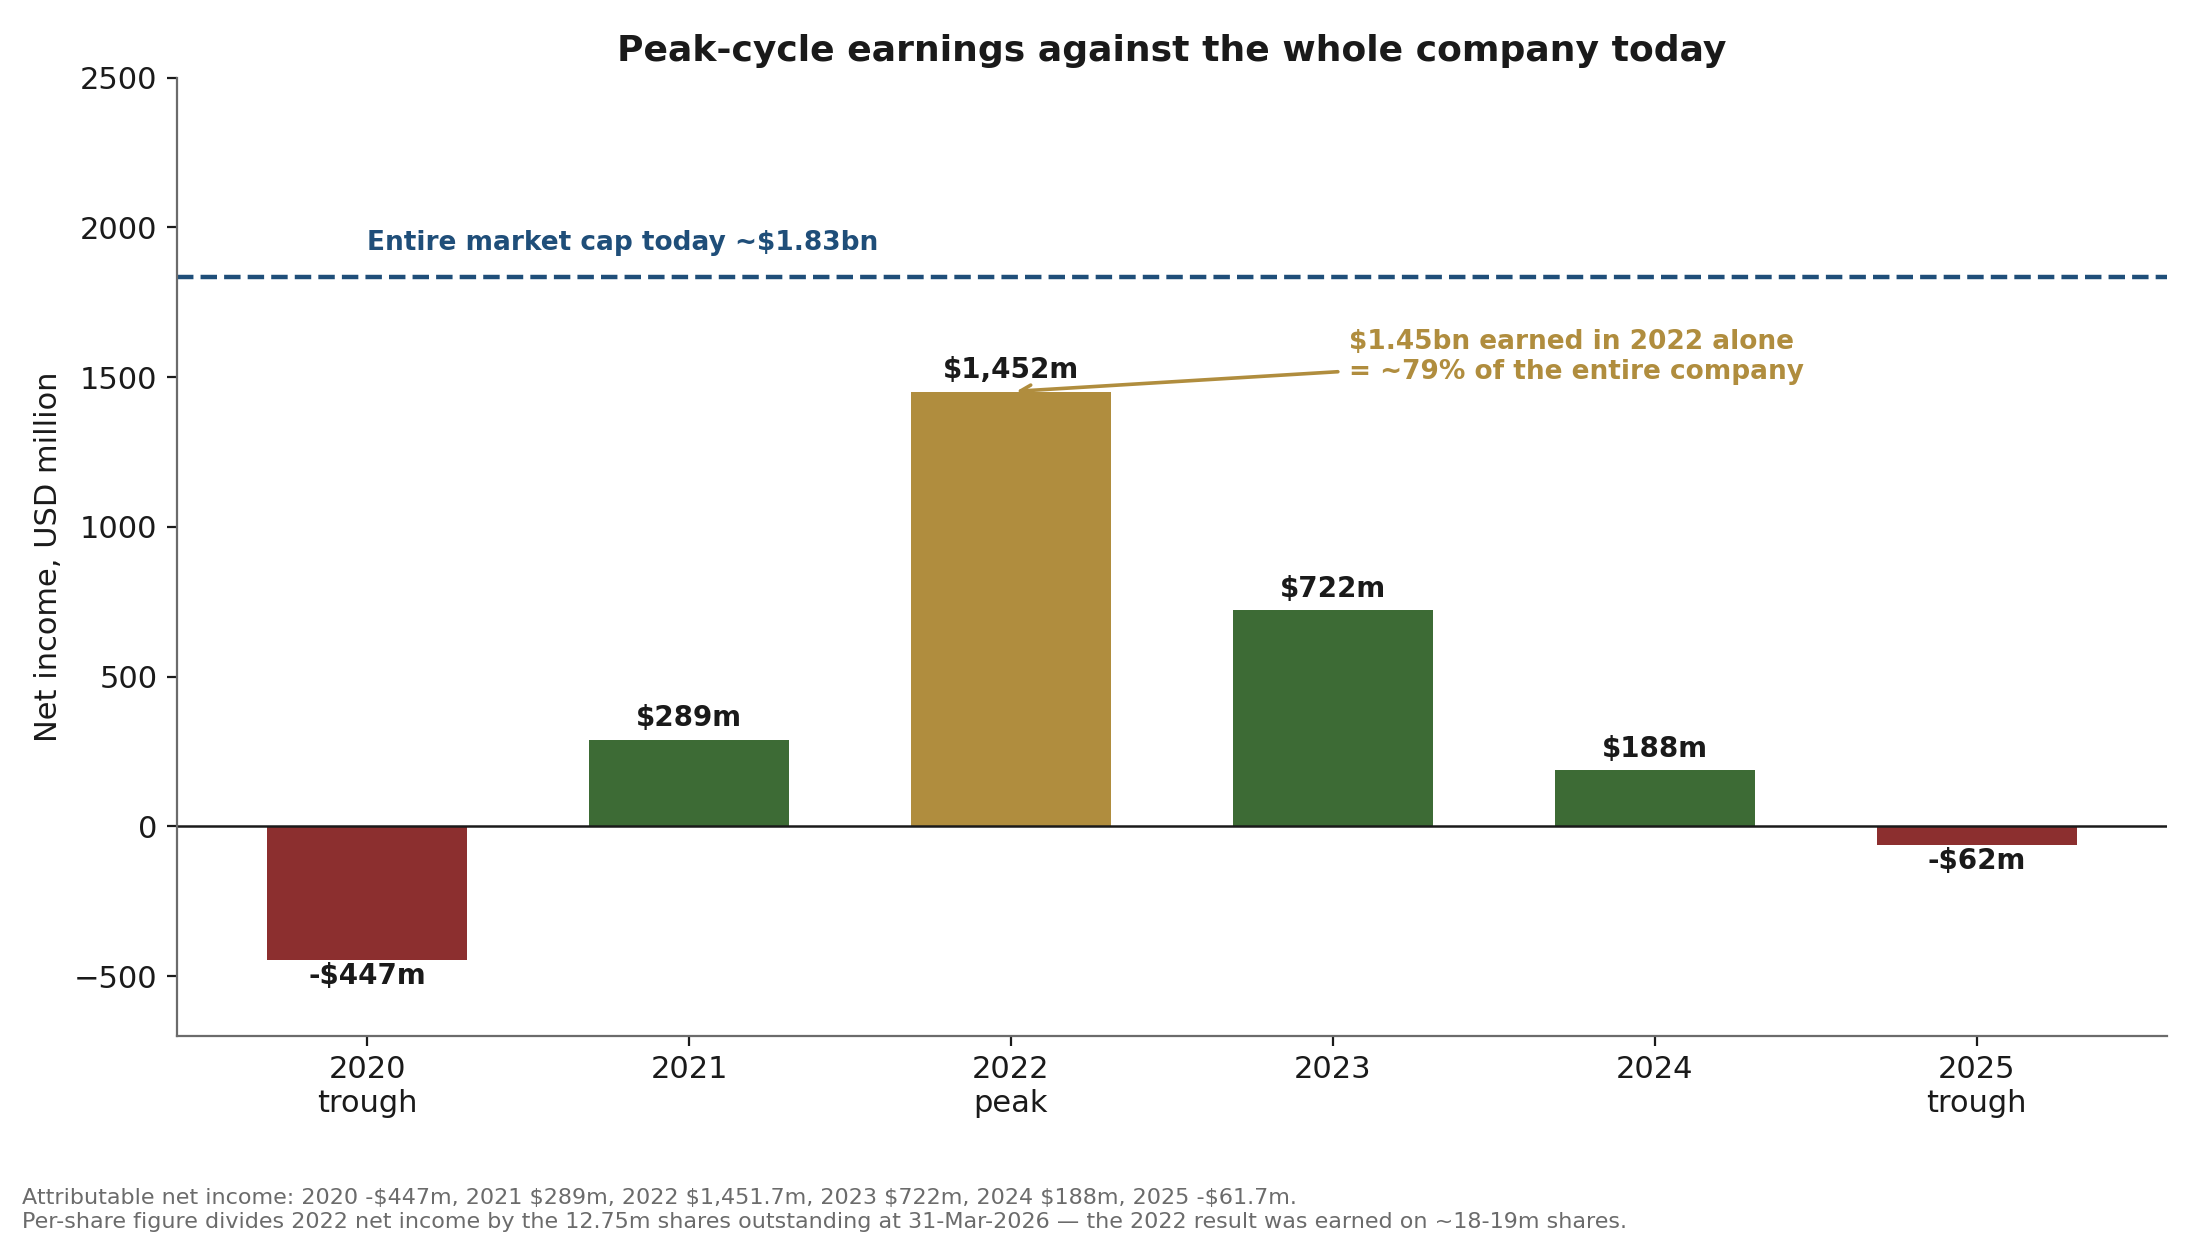
In 2022 AMR generated revenue of ~$4.1bn, net income of $1,451.7m and free cash flow of ~$1.3bn — in one year. The entire company today is worth ~$1.83bn. That single peak year produced net income equal to roughly 79% of the current market capitalisation, and free cash flow equal to about 71% of it. In 2022 alone the company returned $517m through buybacks and $100m in dividends.
The per-share version is the number worth remembering. That $1,451.7m was earned on roughly 18-19m average shares. Divided by the 12,752,824 shares outstanding today, the same profit is ~$114 per share — against a ~$144 share price. Repeating the last peak, with no improvement of any kind, implies about 1.3x peak earnings. The peak FCF works out at ~$102 per share on the same basis.
The cycle then did what cycles do. Revenue fell to $3.47bn (2023), $2.96bn (2024) and $2.13bn (2025); free cash flow stepped down from $1.3bn to $575m to $349m and turned slightly negative in 2025; the trough year produced adjusted EBITDA of $121.9m and a net loss of $61.7m. This is a trough and the thesis depends on it being one. The question is not what AMR earns at the bottom, but whether it reaches the next top intact.
Quantifying survival
“Fortress balance sheet” is an assertion. Here is the arithmetic instead.
At 31 March 2026 AMR held $317.2m of cash plus $49.6m of short-term investments, with an undrawn ABL adding $184.3m of availability for $476.2m of total liquidity, against $12.2m of total debt. In 2025 — the worst year of the cycle, with 15.3 Mt sold and adjusted EBITDA of $121.9m — free cash flow was negative $20.4m.
At that burn rate, the $367m of cash and investments alone funds roughly eighteen years of trough conditions without touching the credit facility. Even at a materially worse $50m annual burn it is more than seven years. The question of whether AMR survives to the next spike is not close.
Two things further stabilise the near term. Guidance for 2026 is 15.1-16.5 Mt of met coal at a cost of $95-101 per ton, with capex of $148-168m plus $35-45m to affiliates — and 48% of met volume is already committed and priced, with 100% of byproduct sold. Q1 2026 realisations show the structure: 1.1 Mt of Australian-indexed export at $144.95, 1.4 Mt of other export at $110.32, and 0.8 Mt of domestic at $137.27. That domestic book, priced annually, is a partial floor under realisations.
Q1 2026: what the most recent quarter actually says
The latest reported quarter was a net loss of $11.0m on revenue of $525.0m, with adjusted EBITDA of ~$30m — an improvement on the prior-year quarter despite two identifiable drags: a planned month-long outage at the DTA export terminal for equipment upgrades, and higher diesel and maintenance costs. The loss is real; so is the fact that it happened in the weakest part of the cycle with the balance sheet barely moving.
The terminal nobody prices
AMR owns 65% of Dominion Terminal Associates, the export terminal at Newport News, alongside 19 mines. In a seaborne market that is vertical integration into the one piece of infrastructure a US exporter cannot do without, and it is not visibly reflected anywhere in the valuation.
It is also a concentration risk, and Q1 2026 proved it: a single planned outage at that terminal was the main driver of a weak quarter. The asset and the risk are the same fact.
Who is buying
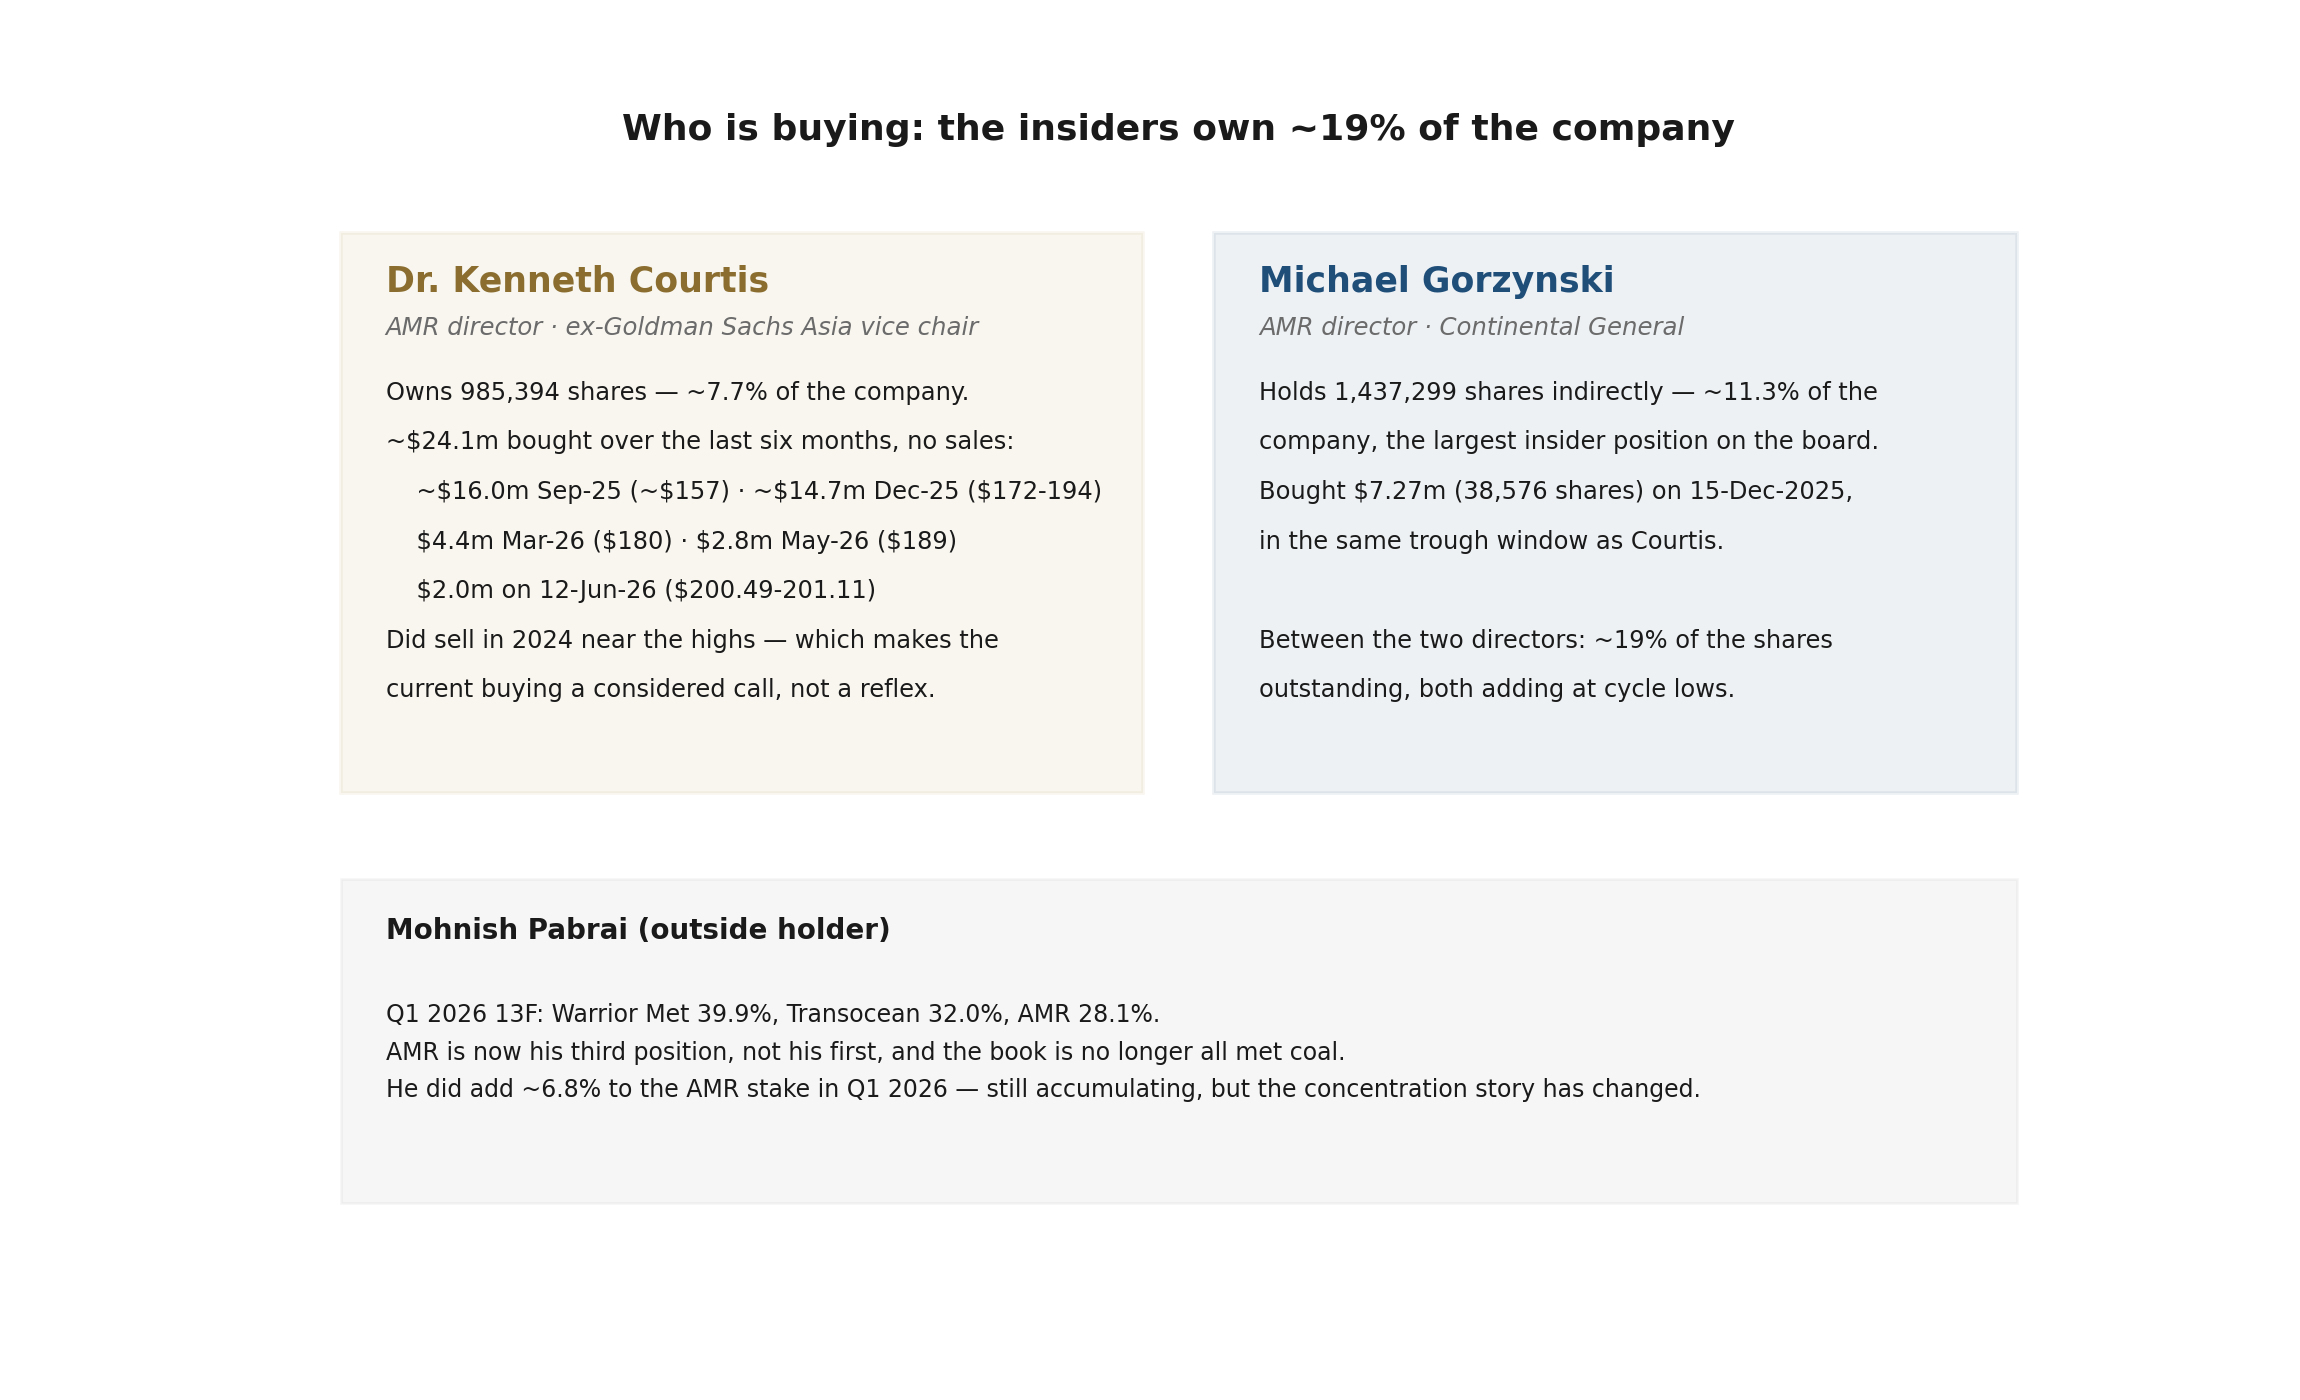
Kenneth Courtis is an AMR director, former vice-chairman of Goldman Sachs (Asia) and former chief economist at Deutsche Bank Asia — a career spent reading exactly the Asian steel and commodity cycles this thesis depends on. He owns 985,394 shares, about 7.7% of the company, and has bought roughly $24.1m over the last six months with no sales: ~$16.0m in September 2025 around $157, ~$14.7m in December 2025 between $172 and $194, $4.4m in March 2026 at ~$180, $2.8m in May at ~$189, and $2.0m on 12 June at $200.49-201.11. He did sell in 2024 near the highs, which makes the current buying a considered call rather than reflexive loyalty.
Michael Gorzynski, also a director, holds 1,437,299 shares indirectly through Continental General — about 11.3% of the company — and added $7.27m (38,576 shares) in December 2025, in the same window. Between the two directors, roughly 19% of the shares outstanding, both adding at cycle lows.
Mohnish Pabrai remains a holder, but the record needs updating: his Q1 2026 13F shows Warrior Met at 39.9%, Transocean at 32.0% and AMR at 28.1%. AMR is his third position, not his first, and the book is no longer concentrated purely in met coal. He did add ~6.8% to the AMR stake during the quarter — still accumulating in the trough, but the “he put his entire US book into met coal” framing is out of date, and it is worth noting that the outside investor most associated with this trade currently weights the competitor more heavily.
Why it is cheap: the ESG discount applies to the stock too
The thesis uses ESG capital flight to explain why supply is short. The same force operates on the equity, and it explains the discount on the share itself: funds with coal exclusions cannot own it regardless of the numbers, it sits outside the ESG index complex, and coverage has collapsed to two analysts in six months — a median target of $186 with B. Riley at $207.
That is the mispricing mechanism, and it also identifies who arbitrages it. The company buys what institutional mandates forbid institutions from buying. A buyback is the natural response to a shareholder base that is structurally constrained rather than economically unconvinced.
The buyback, accurately
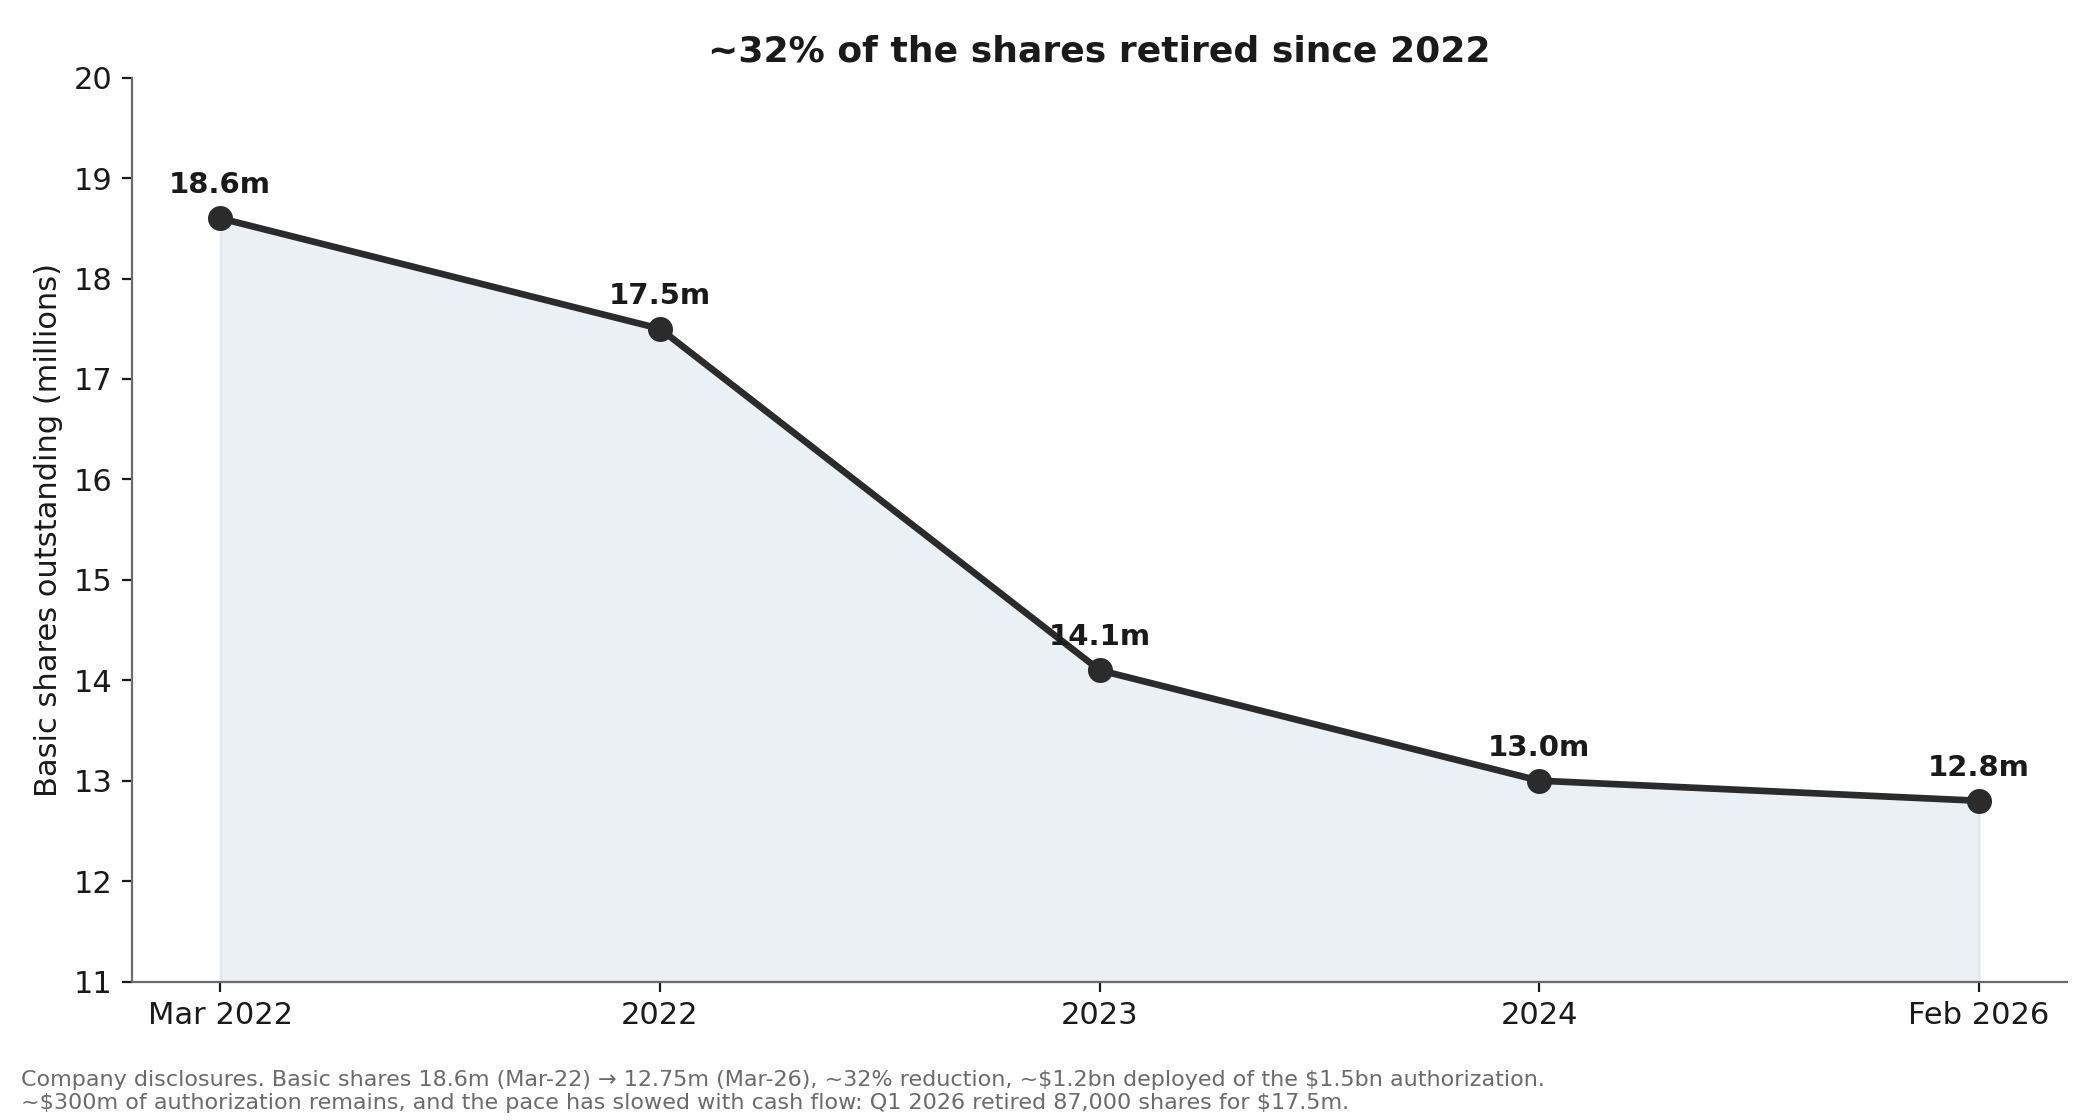
Since March 2022 AMR has retired roughly 7.0 million shares for about $1.2bn, cutting basic shares outstanding by ~32%, at an average price of $165.74. The authorisation was raised in steps — $600m (May 2022), then $1bn, then $1.2bn (February 2023), then $1.5bn (November 2023) — and the dividend was discontinued at the end of 2023 to fund it, after being initiated in Q1 2022 and raised to $0.44 quarterly in February 2023.
Two corrections to how this is usually told. First, ~$300m of authorisation remains, not $1.5bn: the great majority has already been spent. Second, the pace has slowed with cash flow — Q1 2026 retired just 87,000 shares for $17.5m, because a self-funded buyback necessarily throttles when free cash flow is negative. The buyback is a mechanism that works across the cycle, not a lever management can pull at will in the trough.
And an honest mark-to-market: at $165.74 average cost against a ~$144 share price, the repurchases to date are underwater. That does not invalidate the per-share arithmetic — the shares are permanently gone and the next peak is divided among fewer of them — but anyone claiming management timed the bottom perfectly is not looking at the numbers.
AMR against Warrior Met
Anyone researching AMR will look at Warrior Met (HCC) in the same session, and Pabrai now owns more of the latter. The comparison belongs in the thesis rather than outside it.
| AMR | Warrior Met (HCC) | |
|---|---|---|
| Market cap | ~$1.83bn | ~$4.2bn |
| 2026 volume guidance | 15.1-16.5 Mt | 12.5-13.5 Mt |
| Market cap per annual tonne | ~$116 | ~$320 |
| Cash cost guidance | $95-101/ton | $95-110/st |
| Total debt | $12.2m | Modest, post-Blue Creek |
| Liquidity | $476.2m | $363.7m |
| Growth | Kingston Wildcat ramp | Blue Creek: +88% capacity, complete |
HCC is the better operator on cost and has already executed a large growth project — Blue Creek came in with the longwall eight months ahead of schedule, and Q1 2026 delivered record sales of 3.0 Mt and $143.4m of adjusted EBITDA. It trades accordingly.
The choice is explicit: AMR is the cheaper tonnage and the cleaner balance sheet; HCC is the lower cost and the delivered growth, at close to three times the price per annual tonne. This thesis takes the cheap tonnage because the variable that matters most in a cyclical is the price of the commodity, not the last ten dollars of unit cost — and because at 1.3x peak earnings per share, the entry price does more work than the operating margin. That is a defensible choice rather than an obvious one, and Pabrai’s weighting is a legitimate argument on the other side.
Note: HCC’s market cap is derived from its Q1 2026 diluted share count and current price; volume bases should be checked for short vs metric tons before relying on the per-tonne comparison. Warrior also recognised an $8.4m Section 45X credit in Q1 — whether AMR is claiming the same credit on equivalent production is worth confirming.
Valuation
At ~$1.83bn you are buying the largest US pure-play met-coal producer, effectively debt-free, at the bottom of its cycle, with a third of the shares already retired. On trough 2025 numbers the trailing multiple is meaningless — that is what a trough does.
The through-cycle frame is the one that matters. Peak-year net income of ~$114 per share against a ~$144 price means the last peak, unimproved, is already close to being paid for. The downside is bounded by $367m of cash against $12.2m of debt and a burn rate that funds well over a decade of trough. The upside requires only that a supply-starved commodity with a four-to-six-year spike cadence does what it has done four times in fifteen years.
Risks, honestly weighted
- This is the trough, and it is uncomfortable. 2025 was a small loss, Q1 2026 lost $11.0m, free cash flow is negative and the buyback has throttled to a trickle. You are underwriting the wait, not avoiding it.
- The demand glide-path is real. The IEA does project gradual met-coal demand decline to 2030 on rising EAF share and Chinese steel maturity. India is the counterweight, but the bear case is not frivolous.
- China is the swing. Chinese steel and property weakness has driven the price down before and can again; Chinese behaviour dominates the seaborne market.
- Terminal concentration. The 65% DTA stake is an asset and a single point of failure — Q1 2026 showed exactly how a planned outage there flows into results.
- Operational risk. Underground Appalachian mining carries safety, geological and disruption risk, and the Kingston Wildcat ramp must execute.
- No dividend. Capital return is entirely discretionary buyback, and the buyback slows precisely when the shares are cheapest.
- The sell-side disagrees. Two analysts, a median target of $186. Thin coverage cuts both ways: it is why the discount exists and why it may persist.
- Trade policy. Tariffs and export-market access materially affect a producer shipping a large share of output abroad.
What has to be true for this to lose money permanently
A permanent loss from ~$1.83bn requires met coal to sit near trough prices for the better part of a decade — long enough to exhaust a company burning $20m a year against $367m of liquid assets — while India’s import growth stalls, no supply disruption occurs in a market that has produced four in fifteen years, and the retired third of the share count fails to matter when the cycle eventually turns. The asymmetry, not a price forecast, is the thesis.
Catalysts
- Any met-coal price recovery dropping through AMR’s operating leverage into cash flow, and restarting the buyback at a lower share count.
- A supply disruption of the kind that has begun every previous spike — Queensland weather, Chinese policy, or a major outage.
- Indian import data continuing to run ahead of the IEA glide-path, validating the demand leg the consensus underweights.
- Capital return: with ~$300m of authorisation left, a recovery in cash flow makes repurchases at these prices highly accretive per share.
- Continued insider accumulation by directors already holding ~19% of the company.
- Kingston Wildcat ramping low-vol volume into an eventual price recovery.
A note on sizing: metallurgical coal is a volatile, cyclical commodity and this is a trough-of-cycle situation. Position sizing should reflect that.